Just Follow the Arrow and the Dotted Line
Matthew Ritchie explores the history of diagrams at ESMoA
Noema. The very word brings us up short. We might recall that noetics is the study of the intellect, of pure thought, with noesis being the intellect at work, its functionality. And here, swimming in this linguistic teapot, is the vague but powerful noema, defined as the object or content of a thought. In more human terms, it’s a diagram, and “Noema” at ESMoA is no ordinary exhibition but rather a monumental exploration of diagrams as they’ve been employed throughout the ages.
This has been Matthew Ritchie’s journey for the past several years, hacking his way through the underbrush like a character in a H. Rider Haggard novel and discovering a lost city that was in some ways right here the entire time.
“In art historical terms,” Ritchie says in “The Temptation of the Diagram,” his new book, “the diagram is refuge and refugee, a universal visual bridge between the written and the seen, without a home in either.”
Diagrams, which can be summarized in many ways, often function as tools that help us grasp and corral information. A useful diagram clarifies an argument, theory, proposition, etc., and while some are fairly complex, such as the diagrammatic classifications of formal systems as devised by Max Tegmark, others can be quite simple, like a squiggly black arrow on a yellow sign that “says” the road ahead is about to twist and turn.
The essential diagrams
In 2012, Matthew Ritchie was invited by the Getty’s rare-book curator, David Brafman, to be an artist in residence at the Getty Research Institute, or GRI. Each year, there’s a different theme, such as Art and the Soul or the Art of Memory, and in 2012, when 20-some-odd scholars and one artist (Ritchie) were invited, the theme was Artistic Practice.
Ritchie was given a studio with large windows that offered a panoramic view of the South Bay and the Pacific Ocean almost all the way to Hawaii. Unlike a harried journalist who has two days to digest data and then regurgitate an extensive article, Ritchie was given time to collect his thoughts and mull over them.
He began to think about the relationship of knowledge to art, eventually coming around to the question of diagrams. Typing the word “diagrams” into the Getty’s computer system, not much showed up (I joked to him that maybe he’d misspelled the word). At any rate, this intrigued him, but sure enough, the bones of what he wanted was there: “The diagrams get sort of scattered,” he says, sitting down at ESMoA; “they’re kind of art historical orphans.” That is to say, they thrive as a subcategory, and like water pipes or gas lines they may not be readily visible but they link everything together.
Ritchie’s body of inquiry thus began with the question of how we diagram knowledge and how we diagram art.
While in residence at the Getty, Ritchie would ask others about their favorite diagram, and many of them would then descend into the bowels of the ship, as it were, and emerge with an original volume or portfolio (the GRI’s library is a bit deeper, in every sense, than the normal community library).
This process of seeking out notable diagrams went on for a couple of years, with scientists, historians, sociologists, philosophers, neurologists, etc., giving him their recommendations. “Gradually a kind of consensus emerges about the diagrams you can’t (exclude). You have to have Darwin’s diagram, you have to have Newton’s diagram. You probably have two- or three-hundred diagrams that you really can’t do without, each of which embodied a turn of human history.”
Showing him one, people would often say, but wait, there’s this other one you really should see. And often, that other diagram might represent what was at the time an alternative view. “Like for every Darwin,” Ritchie says, “there’s Lamarck with a completely wrongheaded diagram. For every Adam Smith there’s a kind of Marxist diagram of labor. So then you sort of have to include all the paths not taken.”
Eventually the search stabilized at about 3,000 diagrams, of which 816 made the final cut. But more on that later.
Some endure, some don’t
While at the Getty, Matthew Ritchie attached hundreds of photocopies on the walls of his studio. Kenneth Rogers, a fellow researcher at the time, describes what he saw, this being “diagrams in the form of cartographies, charts, Venn sets, schemata, taxonomies, tables, graphs, dendrograms, rebuses, topographies, calendars, and mechanical drawings; diagrams representing the fields of physics, mathematics, cosmology, theology, psychology, biology, science, technology, linguistics, and the history of art; diagrams sourced from diverse geographic locations, cultures, and historical periods, from antiquity to the present.”
Rogers also points out that “Ritchie is less interested in the diagram of power than in the power of the diagram,” although that power or eminence may flicker as the years pass.
Ritchie notes that “There’s really no idea that doesn’t have a diagram behind it. Some of them are completely fictional, some are completely fantastical, some are completely scientific; and what you see over time is that those things change places. Like Descartes will put forward the idea of the multiverse, before there’s any real idea of even what a multiverse might be.” Derided as hogwash, “then hundreds of years later we’re like, You know what? That’s a pretty good idea. And now we have a real theory of the universe.” In short, redemption.
It can, of course, also work the other way. As Ritchie says in his new book, “In a diagram, the distinction between reality and unreality, between connection and conspiracy, is as thin as the paper the diagram is drawn on.” In short, superseded or shown to be false, as with Lamarck compared to Darwin.
Sometimes an assumption, or a leap of faith, proved erroneous. Isaac Newton, Ritchie says, struggled to reconcile his theories of science with what was then known of the universe. For example, as Brafman points out, because there were seven notes in the chromatic scale of music, seven known planets (a number that still seems to fluctuate!), and presumably seven elementary metals, there had to be seven primary colors.
Ritchie shows us Newton’s color wheel. “There really aren’t seven colors, but Newton was an ardent alchemist, so he knew everything had to have seven components to be alchemically correct. So he sort of added one. Indigo, which is just dark blue.”
As times change, so does emphasis. Looking over Darwin’s writings or diagrams concerning his theory of evolution, the prevalent question may have been, Yes, but does he believe in God or How does God figure into this? It’s true that even in the 21st century there are people still living in the 18th, but for the most part scientific inquiry has pulled ahead while theological concerns have taken a back seat.
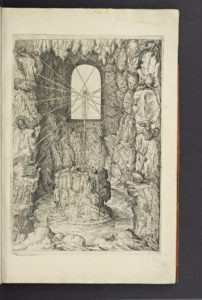
Sometimes, while purporting to be true, a diagram can be visually misleading. Ritchie points to a medieval diagram by Ramon Llull: “It seems like he’s got it all figured out. All he has to do is climb this moral staircase, spin the wheel of… the proper sensibilities, and you’ll ascend to the palace of knowledge.” This has been paired with a modern diagram for a world systems theory proposed by Fernand Braudel and Giovanni Arrighi, the stepping-up pattern of which gives the same optimistic impression. Many of us have seen these same basic diagrams or graphs from our financial institutions, to assure us that ultimately all is well.
Diagrams can often shed light on an issue, perhaps exposing a truth that people have wanted to avoid or deny:
“One of the most powerful diagrams I’ve seen is the counterinsurgency diagram that the Pentagon came up with for the war in Afghanistan,” Ritchie says. “It’s so complicated, they realized at that moment they’d essentially lost the conflict. There’s no resolution. It reveals the war as a fantasy, (with) no way to get all these competing forces to work toward one common goal. And it was kind of a key moment in the Pentagon’s thinking about the war. It’s not a mess, it’s all very organized, but you cannot organize it to a single common thread.”
Getting in on the act
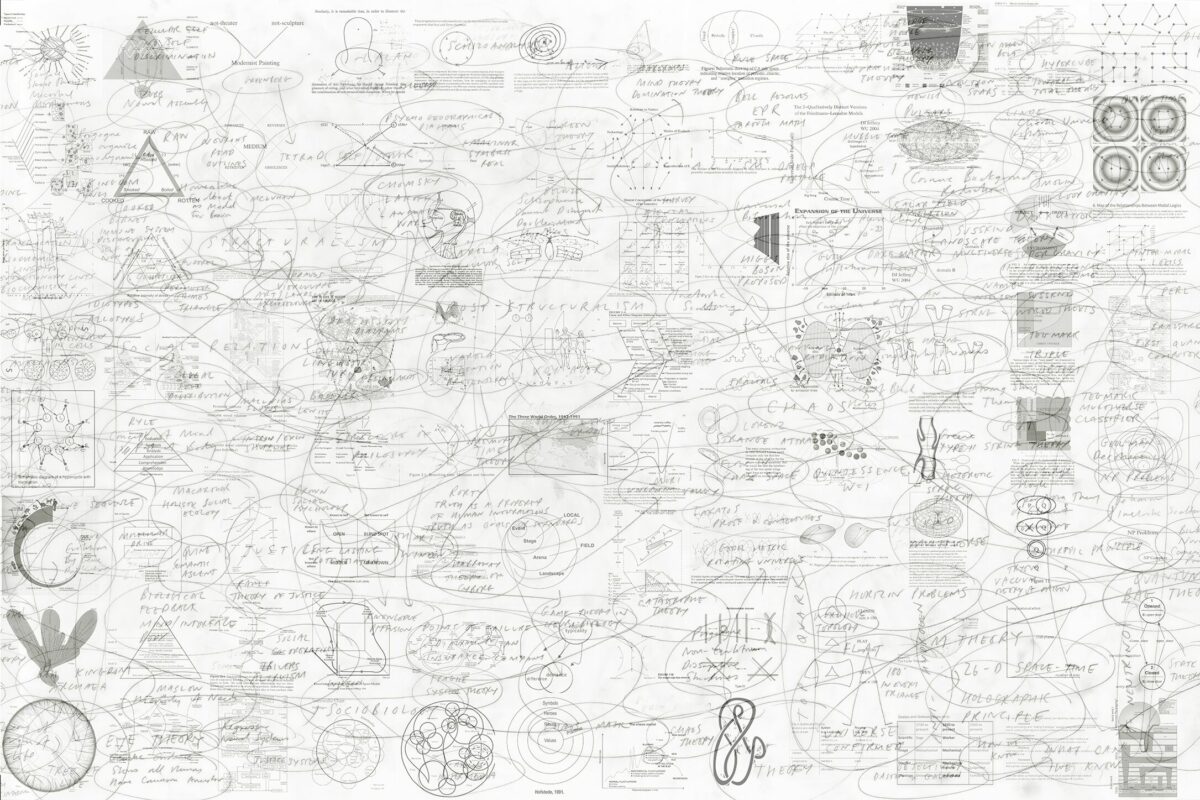
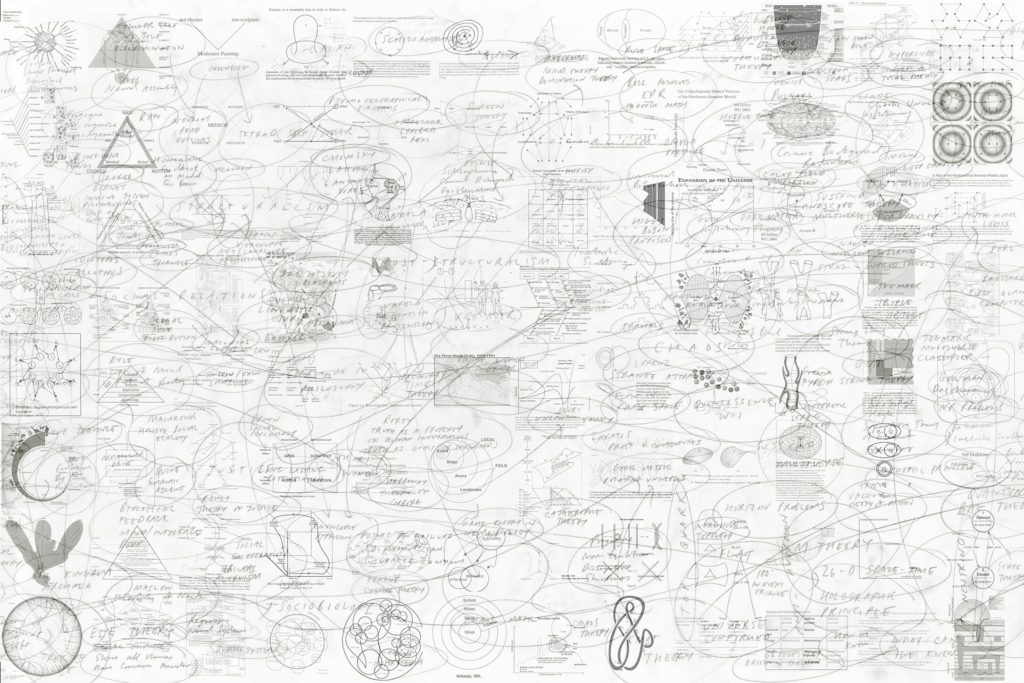
Ritchie’s Getty project, on a paper foldout twenty-five-and-a-half feet long with its 816 diagrams, is “organized loosely as a timeline of the use of diagrams across history,” as he explains in his book. “It is not a history of the diagram, but an art historical thought experiment, an anti-history, as the idea of the diagram itself constantly fights against the idea of linear development, preferring to proliferate in every direction, including across time.”
In pencil, freehand, he has drawn arching lines and circles that seem to connect the hundreds of diagrams as they race towards the present. One thinks of scientific equations on a chalkboard.
Also, he later adds, “Incomplete or not, each generation of diagrams incorporates the previous era and becomes the substrate for the next. Diagrams not only describe reality but also in some sense enlarge it, simply by coming into being.”
As complex as the project may seem in its details, for Ritchie is an astonishing polymath, he wants to emphasize and to “convince people that thinking isn’t scary, and that the way to make it not scary is to do diagrams of thinking and realize that you too can have this kind of free space of thought. There is no limit to what you’re allowed to think.”
The journey, in other words, is ongoing, and we’re encouraged to add to it. “Every time you make a little map or do a sketch to show someone how to get somewhere, you’re kind of contributing to that tradition,” Ritchie says. “A key part of the show is showing that this tradition is open, hoping the diagram never ends. There’s always room for one more.”
Noema, which opened Sunday, is on display through August 27 at ESMoA, 208 Main St., El Segundo. An immersive 160-foot abstract version of “The Temptation of the Diagram” covers much of three walls and greets the viewer who steps inside. The exhibition includes rare books on loan from the Getty Research Institute as well as artworks from ESMoA’s own collection, with related events to be announced, including a dance performance by L.A. choreographer Flora Wiegmann on a large diagram on the floor of the gallery that resembles the outlines of a futuristic basketball court. It’s a concise, thought-provoking show, but we didn’t forget, did we, that ESMoA has long promoted itself as an art laboratory, a home for the new and the unusual. (424) 277-1020 or go to ESMoA.org. ER